What is the Data Presentation Layer?
Author: Jake Hammacott
Release Date: 18/11/2024
In today’s digital age, data is generated everywhere - from the computers end-users work on to sensors found miles below the ground. Every device we use and interact with creates a constant flow of information whether in logs, metrics or any other form of data. This data holds valuable insights that can drive decision making, improve efficiency and transform industries. From tracking personal health, to optimising supply chains, the ability to capture and analyse data from varied sources unlocks the potential to revolutionise the way organisations work and think.
With so much data coming from many different sources, it can be difficult to dissect and make appropriate analysis of any changes, trends or anomalies by just looking at the raw data itself. However, by incorporating a Data Presentation Layer into your data pipeline, all events and logs can be utilised quickly and efficiently. Analysts will have a dedicated tool that is designed to search, report and alert on large volumes of varied data, making identifying trends, patterns and anomalies much simpler. Ultimately, the data presentation layer aims to take vast quantities of raw data and provide clear, actionable insights that can be actively worked on and addressed.
In this blog, we’ll go through challenges found with attempting to collate data from different sources and some struggles that are common even once data is brought together. Afterwards, the relationship between Confluent and Splunk will be examined - demonstrating the power of an efficient data presentation layer.
The Challenges
With data varying between different types of systems, models, functions and sources, it’s very common to have massive amounts of data and for very little of it to look the same. A sensor may create logs measuring changes in air quality, whilst a server could be creating web access logs - although both of these sources are creating valuable information, they may not even be generated in the same network (or could sit on opposite sides of the planet!). When trying to collate data, it is often found that different teams are created in different departments and geographic locations that allows them to work close to the data they utilise. This typically creates widely varied results, where one organisation may thrive with these conditions, another may struggle to justify having multiple analyst teams spaced throughout different locations.
Data is often time-critical, which is the case in many use-cases, for instance:
• Security Teams: SOC’s (Security Operation Centre) are most efficient when data has a high availability. Having a large delay between logs/events initially generated to them then hitting the SIEM (or alternative) solution means that security incidents may be acted on too late. This increases the risk and impact true positive events bring when they occur, as your analysts are left with a large delay - leaving them to start investigating and remediating two steps behind any malicious actor.
• Location based tracking: Any device that utilises GPS or other location tracking is, again, most efficient when providing as close to real time updates as possible. If you have a fleet of 1,000 delivery vehicles and they each have a 48 hour delay on receiving data into your data presentation layer platform, incidents could be missed that could have already been addressed or even prevented.
• Sensors: Sensors are used to track specific variables. They are used as a measuring device to track changes in these variables in environments that require very specific conditions. If sensor data is delayed or unavailable, dangerous changes in the environment could be left unaddressed which could cause damage to equipment, personnel or infrastructure.
Whilst only listing a few use-cases for time-critical data, the importance of maintaining an efficient and fast stream of data becomes obvious. Without a reliable way for analysts or end-users to access data that is relevant and specific to them, problems can easily be missed or addressed once it's already too late.
The Solution
This is where a few solutions come together: Confluent empowers organisations to effectively transport and send data across infrastructure and networks. This allows for data to be housed in any location, regardless of where it was initially generated. When paired with Splunk, this data can then be efficiently worked with to provide as much value as possible through enriching and indexing any and all sources of data.
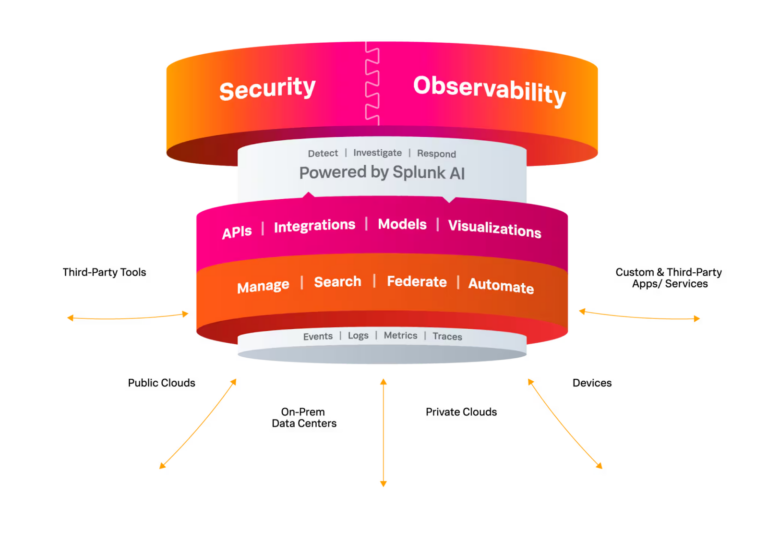
Splunk, when utilised alongside Confluent, acts as the Data Presentation Layer. This is where all events can be analysed through searches, reports, alerts and dashboards to ensure that important events are never missed and available for as long as necessary. By combining the functionality of Confluent and Splunk, data becomes available and actionable in dramatically decreased time. Splunk has the power to handle and work with any data sent its way, making the problem of highly varied data of large volumes negligible (providing you have the hardware to support).

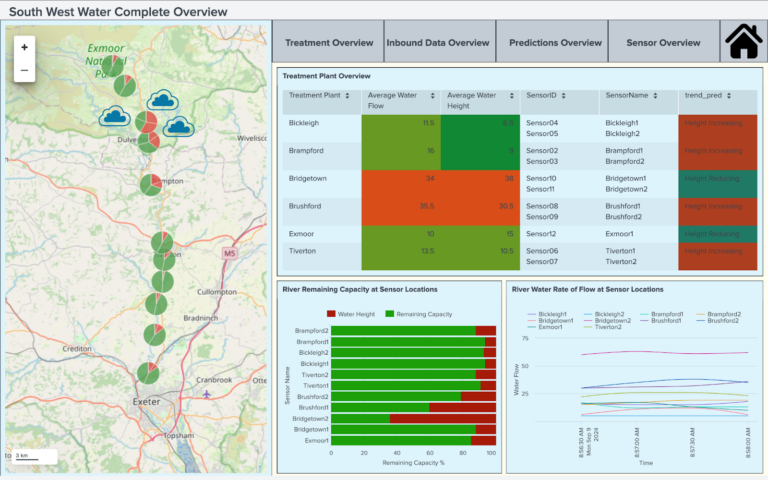
For example, in the water treatment industry, sensors may be placed along major rivers, lakes and water treatment plants. These sensors could measure and collect data about the water height, flow and quality. If Confluent and Splunk are introduced to this scenario, instead of having to have engineers tracking each sensor manually, or through rather primitive IT infrastructure that cannot support the visualisation of “the bigger picture”, then problems may arise. For instance, these engineers or analysts may have a very limited view on the overall state of water quality throughout the entire water system. Problems further up a river may lead to a knock on event that impacts the rest of the river and could lead to the pollution of safe drinking water. Confluent and Splunk would empower engineers to be able to have the required access to data related to their entire job. In the same scenario, where problems further up the river decrease the water quality and potentially affect other areas of the system, the engineers would be alerted and notified about the concern and would be able to make any relevant changes and decisions in near-real time. This, ultimately, decreases the risk and impact caused by pollutants entering the water in the river as the engineers are prepared and made aware of all risky events.
Dashboards could, additionally, be developed to assist in providing a single-pane of glass into the entire water system - promoting quick analysis whilst also allowing for richer event data through the use of Splunk’s drill down searches and supporting dashboards. An overview dashboard could look something like this:

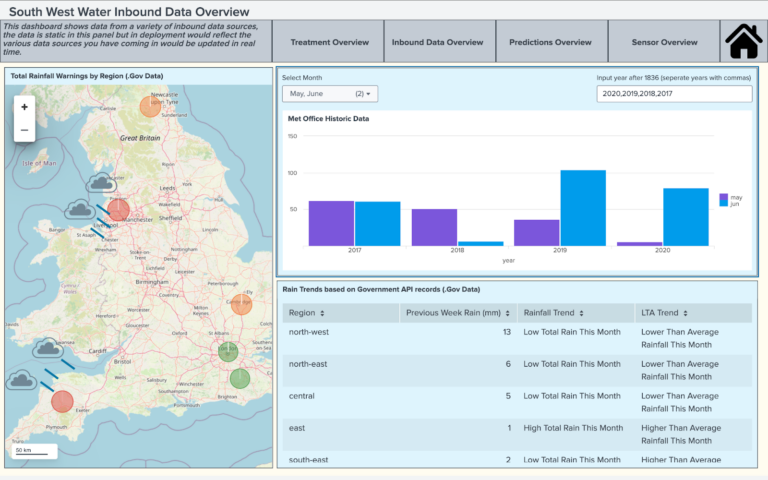
Here, data from treatment plants and sensors in rivers are brought together to provide an immediate overview of the current state of events happening in the water system. Additionally, Confluent and Splunk promote the use of external data to further complement existing data obtained internally. To further build on this example, the following dashboard utilises historic data available through a Met Office API to document and allow for statistical analysis when comparing current rainfall with previous years:

In this simulation, the presentation layer has been used to bring data from many different water systems across the UK to be further enriched by existing data that is readily available. It has then been sent and indexed within Splunk, where alerts, dashboards and reports have been set up and maintained to provide real-time updates sent directly to key decision-makers.
Wrapping Up
Overall, combining Confluent and Splunk and adopting them into your existing infrastructure promotes an increase to operational efficiency across the whole of your organisation’s data. Data becomes widely available to those trusted with it and can be obtained and stored in drastically reduced times, regardless of geographical or network location. Splunk can be adopted to automate a huge amount of statistical analysis, machine learning predictions and actionable remediations - reducing the burden on your analysts, engineers or security team. This, again, allows for your teams to focus on what’s really important in your organisation and its data - increasing your work-force efficiency.


